Apr 11, 2010

Are we driving more efficiently?


Annual highway-vehicle miles per gallon of motor gasoline vs. Chained motor gasoline price


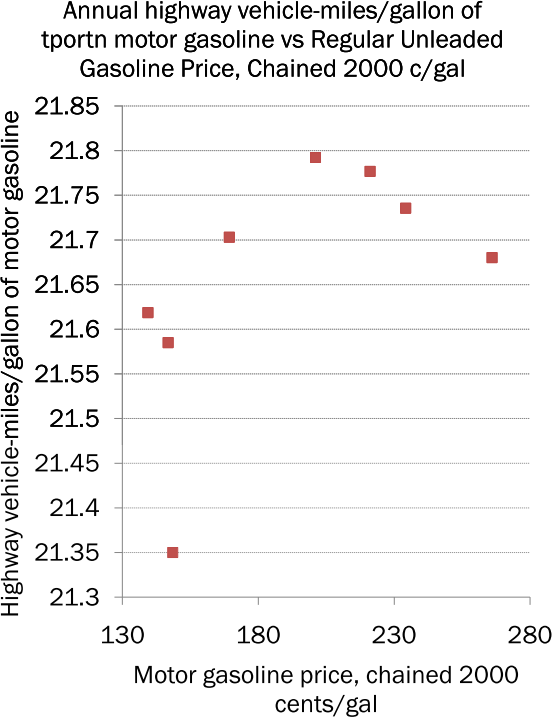
With gas prices inching back up to 3 $/gal, the accepted idea is that people are driving less because of higher gas prices. Does this graph support the idea? (I used data from Federal Highway Administration and EIA to get the data).

Read More...

Apr 1, 2010

Bottled Water - Energy


Effect of increased oil prices on bottled water revenues


The motivation for this article comes from the "Oil-in-Big-Macs" work by Gregor. This is a graph that I put together taking data from International Bottled Water Association and the Energy Information Administration (EIA). I used the price of gasoline as a proxy for oil/energy prices. The revenues, both real and nominal are affected by higher energy prices. Watch out for more single-figure articles on natural gas, water and energy in general.

Read More...

Mar 13, 2010

Natural Gas Prices and Demand from EIA forecasts


From

Natural gas prices and demand from EIA Annual Energy Outlook 2009, 2010


This is a combination of data from the EIA Annual Energy Outlook 2009 and 2010. The price data for 2009 were given in 2007 $ and were scaled to account for inflation. The demand curve for 2009 shows an inflection at years past 2025, which is not reflected in the AEO 2010 data. The term "quad" refers to quadrillion (1015) BTU). Each quadrillion BTU of natural gas is equivalent to approximately 1000 billion standard cubic feet of gas.

Read More...

 
The Energy Webring