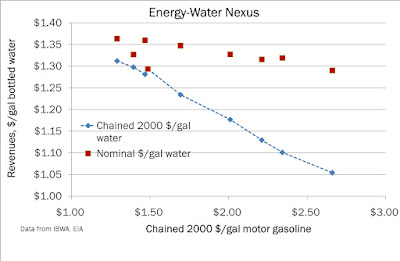
Effect of increased oil prices on bottled water revenues
The motivation for this article comes from the "Oil-in-Big-Macs" work by Gregor. This is a graph that I put together taking data from International Bottled Water Association and the Energy Information Administration (EIA). I used the price of gasoline as a proxy for oil/energy prices. The revenues, both real and nominal are affected by higher energy prices. Watch out for more single-figure articles on natural gas, water and energy in general.


2 comments:
exgood blog ...and nice information
Post a Comment